Mapping a Stage 2 H-D
A customer contacted me about mapping his Stage 2 Delphi Harley.
He said that it ran bad enough that it wasn't any fun. He had had the dealer load a Stage two map with a Scanalyzer. Then they suggested he purchase the S-E EFI Race Tuner Kit. He had the dealer load the Stage 2 map from Race Tuner Kit and that didn't solve the problems either. After that he took it to his favorite independent H-D service shop and they made some changes which helped but there still some drivability issue.
That's how I got it.
I don't get to test any Stage 2 builds because the dealers usually do those and most often on brand new bikes. My customers are usually referred from independent shops that are trying to make more power than the 'factory' kits can accomplish.
This bike had all the components from the catalogue and no more. That is to say, the S-E 203 cams, the S-E slip-on mufflers, the S-E air cleaner, and the S-E flat-top 95CI pistons. Just like in the catalogue.
First, I warmed the bike up and made a 'baseline' WOT run with the modified map that was in the ECU.
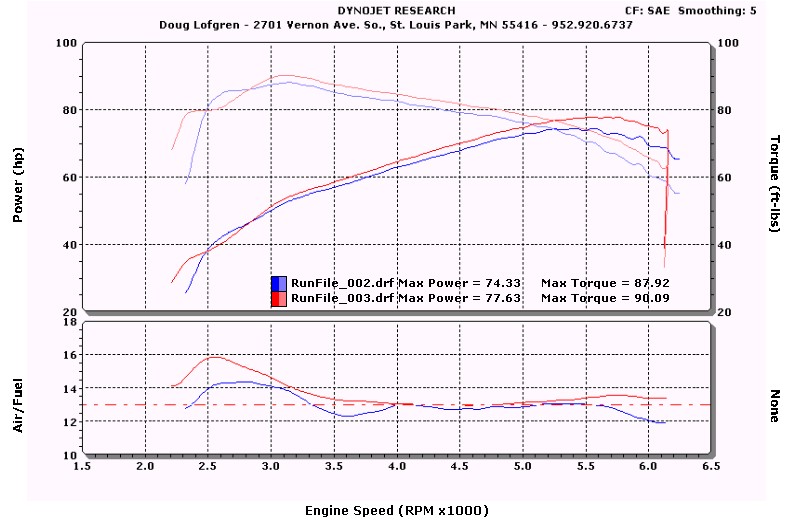
Next, I loaded the Race Tuner Stage 2 map and checked the WOT fuel with that. The result is the chart below.
The RT (Race Tuner) map makes a little more power than the modified one because the modified map was just a bit rich. The modified map is better at the 2500 RPM area where the RT map is way too lean. and it goes too rich way up at the top.
I don't know what the starting point map was and it doesn't matter, the worst of the problems aren't at WOT they are in the part throttle range. That is where I'll concentrate to make the bike enjoyable.
I've found that the stock exhaust header on the Road King and Ultra Classic is as good as almost anything available in the under-90HP range (the Bassani equal length True-Duals work just a little bit better.) The only problem with the stock header is that you can't get good air/fuel ratio information from the rear cylinder with the stock system. The left side pipe junction doesn't appear to help the power, but it does allow oxygen to get into that pipe and interfere with the A/F ratio reading for the rear cylinder.
My solution to that problem is to remove the left side muffler and put a plug into the pipe. In case you think that it might have an affect on the power/performance I offer the following chart. This shows a later WOT run with the front A/F ratio getting close with full system in place (red) and the first WOT rear cylinder check with the left muffler removed and the left pipe plugged.
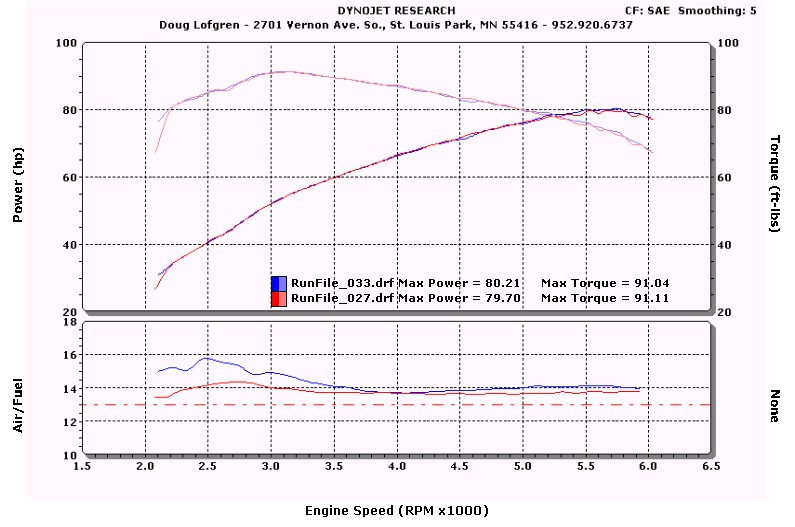
You will notice that there is virtually no difference in power or torque while the A/F ratio of the rear cylinder is lean at 2500 RPM just as the baseline of the front cylinder was with the stock Stage 2 map.
(Remember what I said about the under-90HP range. Subsequent testing has shown that there can be significant difference in performance with the left side pipe in over-100HP applications.) (But, that's another story.)
Since the 'factory' stage 2 maps are supposed to be made specifically for this engine combination I was surprised that the WOT fueling was so far off at 2500 RPM. I would expect that the mapping at low throttles would be lean for EPA certification, but didn't expect the WOT to be anything but rich. My experience with manufacturers' maps is that they usually make the high loads quite rich thinking that rich is safe. I don't even agree that. But, who am I?
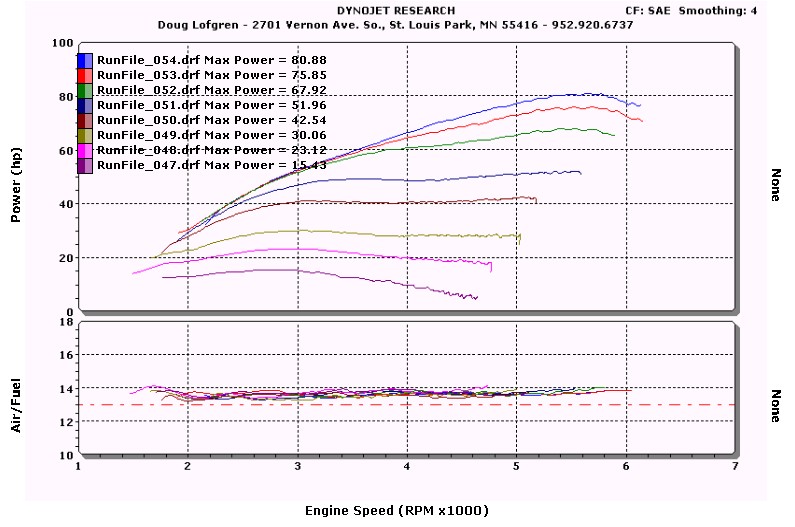
Below is chart showing the front cylinder A/F ratio vs. RPM traces of most of the throttle positions on the RT 'Stage 2' map.
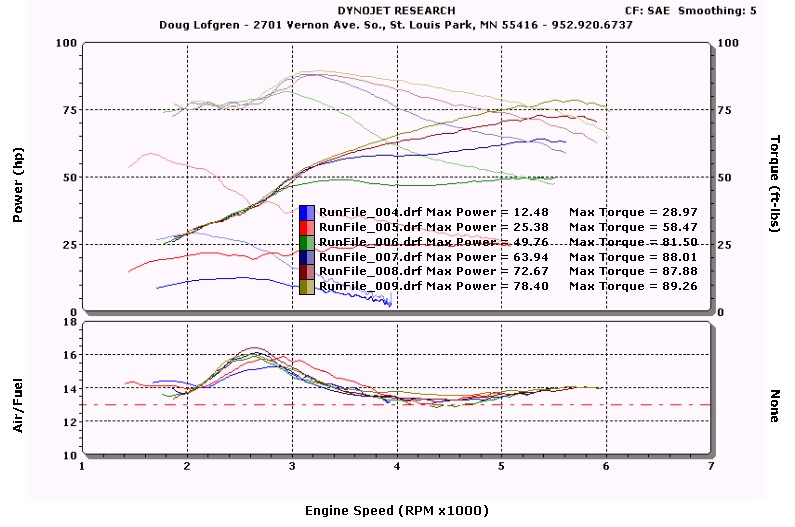
They are consistently lean at the 2500 RPM range and go lean above 5000 RPM. It appears like this map doesn't fit this engine configuration.
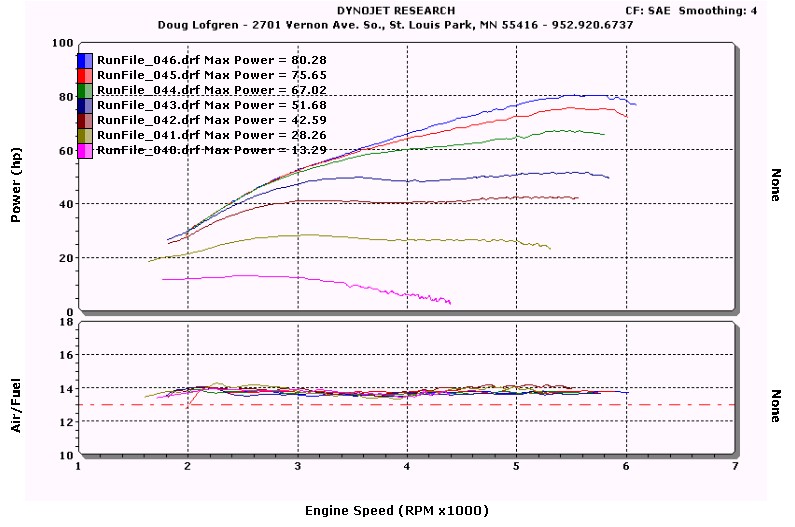
Just in case I'm missing something, I'll show a chart of the A/F ratio vs. RPM of the rear map.
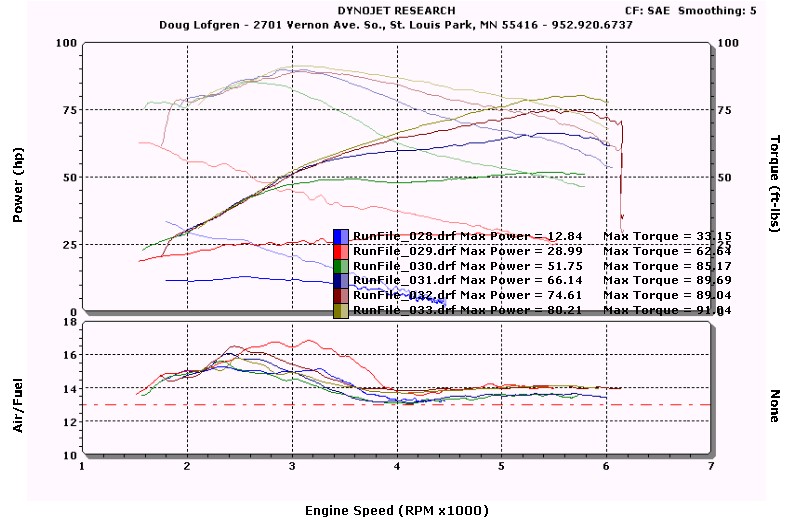
It shows the same kind of excursion as the front cylinder with the exception of a greater lean condition on the 20% throttle line (red).
After several series of adjustments of the front cylinder map, the A/F ratio chart looked like this;
I use the Race Tuner Manuals suggestion of adjusting the Air/fuel map to 13.5:1 everywhere, so all of the A/F traces should be 13.5:1. As you can see they're not exactly there, but pretty close. The important part is that there aren't any big excursions.
Here's the rear cylinder chart.
I performed one more adjustment of the rear cylinder map after this without checking the results. You might be able to tell that the 20% throttle line is lean at 2-3000 RPM, so I added some fuel there and did some adjustments of other throttle position/RPM points.
After both cylinders have flat A/F maps the A/F ratio Speed/Density map is adjusted to make the WOT richer and each lower MAP value is made a little leaner.
Finally, the timing is adjusted for best power. If I don't know what the timing should be I first retard the WOT timing by two degrees. If it looses power I advance the WOT timing by two degrees. If I advance the timing and the power doesn't increase, I know that I'm probably bracketing the max timing. In that case I usually opt for the lowest timing that gets the best power.
Finally, I turn on the Anti-knock and check for timing retard during the WOT run. I usually test for anti-knock activity at 100C cylinder head temperature. If the engine temp goes higher than that, the anti-knock should protect it. If you're trying to get the best power out of your engine (dyno shoot-out) you shouldn't be above 100 degrees C anyway.
The chart below shows the difference in WOT power, torque, and A/F ratio before (blue) and after (red) mapping.
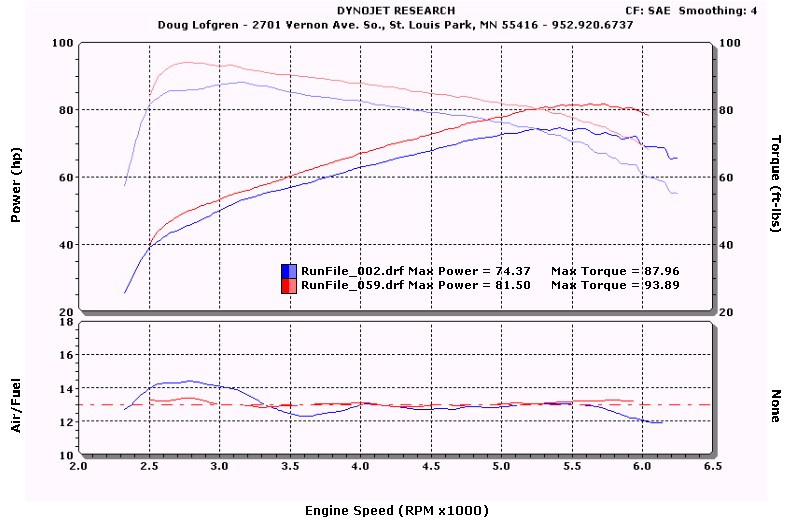
This is an example of why I keep claiming that each bike needs to be custom mapped.
I'm surprised (and I'm not) how far off the stage 2 map from Screamin' Eagle was. I would have expected to see the whole thing too rich if the fuel pressure was at the highest specification (4 bar + .25 bar) or too lean at the lowest spec. (4 bar - .25 bar) but I didn't expect to see the A/F ratio lines anything but flat.
If the map truly fit the application, the A/F lines would be flat even if rich or lean. The fuel map will ultimately be the same shape as the torque curve at every throttle position.
Why? The torque peak is the volumetric efficiency peak, the point where the amount of air the the engine processes, per revolution, is the greatest. That is where you will need the greatest amount of fuel per revolution. Above the torque peak, the fuel per cycle will decrease but the total fuel over time (and the power) may still be greater because there are more cycles per unit of time.